May the state machine be with you!
It’s been a long time that I worked on an open source project, so I spent the last couple of weekends building a tool that I always wanted to be in my development toolbox, so here comes my second open source contribution after the DTOnator. welcome the StateArt!
What is StateArt?
StateArt is a visualization tool built as a plugin for IntelliJ based IDE’S which helps you visualize the StateMachine DSLas state machine diagram. It deserves a separate post to explain when and why to use a state machine and how it helps to simplify your workflows. So I keep this post limited to explain how the tool works and how you can help improve it.
In the world of opensource we don’t give people fish, we teach them how to fish.
How to install?
StateArt is available as a plugin for IntelliJ based IDE’s like Android Studio and distributed through JetBrains plugins store, so you can always install it directly from your IDE, if you are not sure about how to install a plugin please follow the installation instruction in the StateArt Github repository or click the button below
What does it do?
If a picture worth a thousand words, what is the worth of a gif?
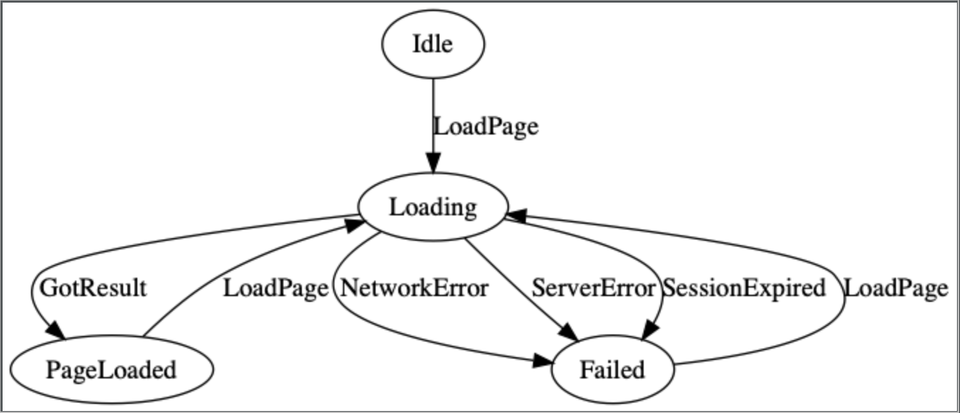
StateArt plugin works as a line marker in the IDE, that it auto-detects the line which uses the StateMachine DSL and marks it with a special icon.
Double-clicking this icon will generate the state machine diagram for the state machine and opens it in a new tab in the IDE. Note that it regenerates the image every time you click on it, making it a perfect tool to help with the incremental development approaches.
What is GraphViz?
Graphviz is a popular open source graph visualization tool, also a secret sauce of StateArt plugin, which helps to visualize graphs from some textual representation of a graph called dot file.
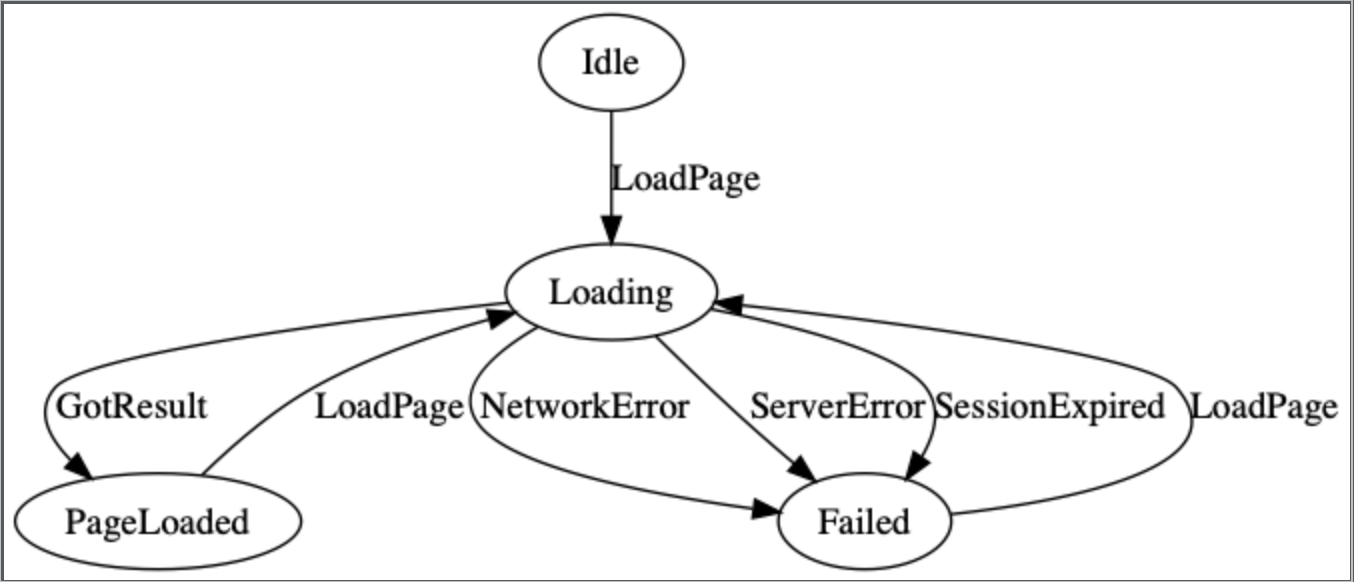
For example here is the dot file for the state machine shown in the above gif
And it is the dot command from Graphviz which converts the above dot file to an image shown in the gif
StateArt plugin parses the source code written using StateMachine DSL to create a dot file, then the dot file is converted to an image using Graphviz
How does it work?
The StateArt plugin has two important things to do, and it works in two steps
- Parse the StateMachine DSL and generate an internal representation of the state machine also called as a data structure
- Consume the data structure created in the first step and convert it into a dot file
Here is an image representing the entire workflow
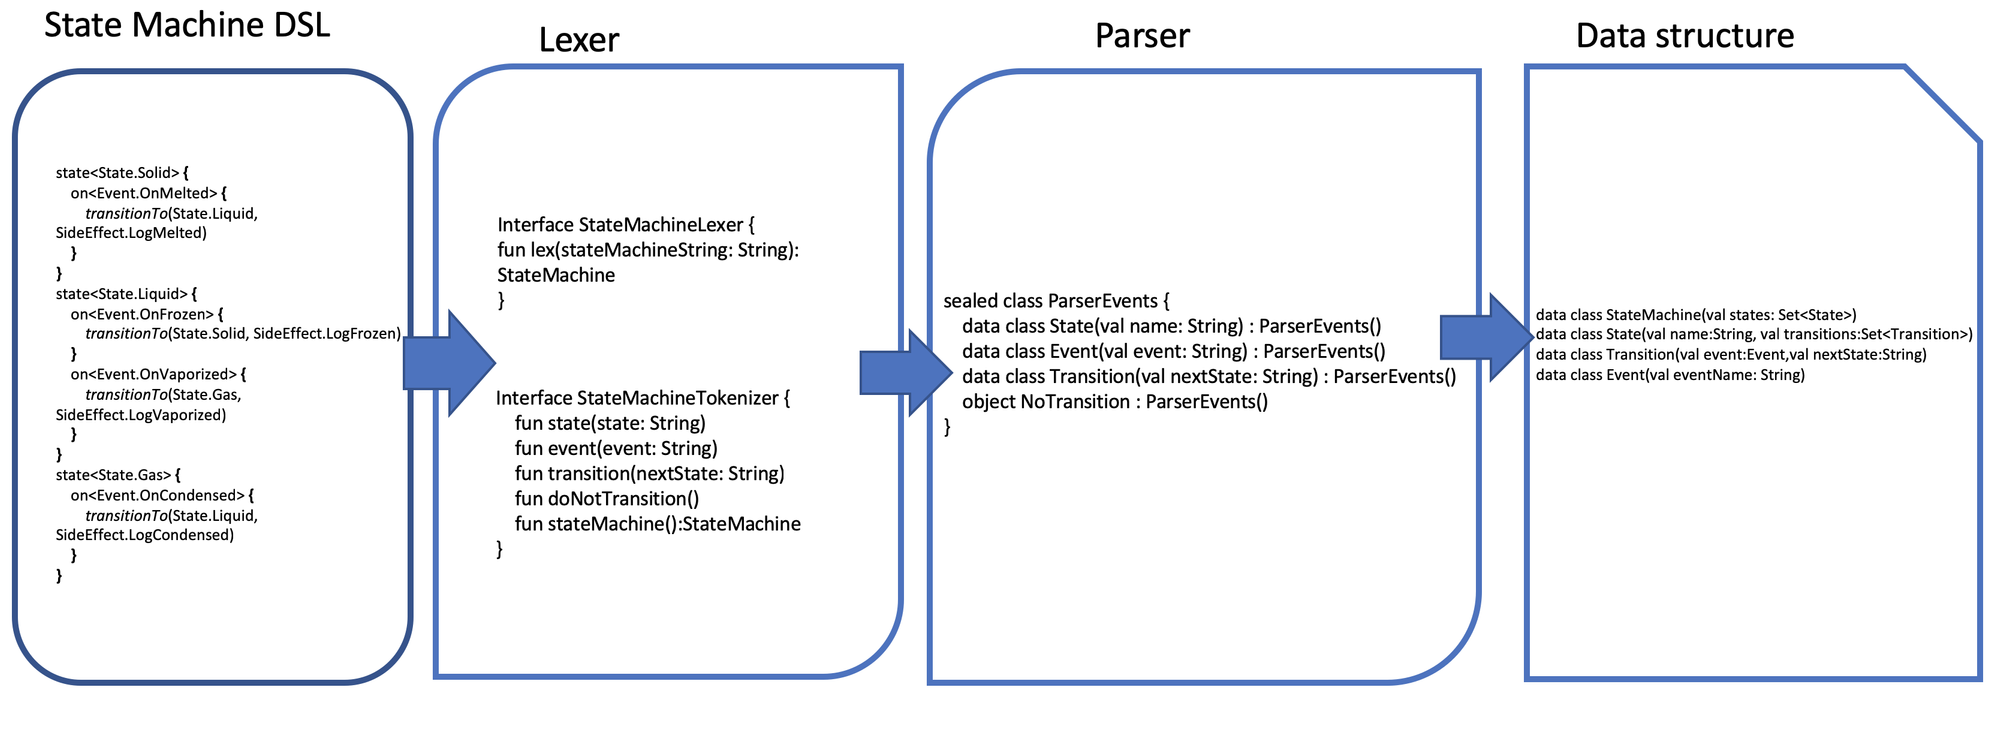
The StateMachine DSL is scanned line by line extracting as many valid tokens as possible using the regex, these token are then passed to a parser where it evaluates the semantics. If the parser gets the right semantics it constructs an internal data structure representing the state machine.
Here is how the internal representation or the data structure looks like.
The data structure is an important part of the abstraction as it is independent of the source format from which it is populated, and also completely unaware of the output format to which it will get converted to.
For example, if you need to support visualizing a totally different implementation of state machine you can do so by only changing the tokenizer to accept the new syntax of the implementation, similarly if you need to support a completely different output format you only need to change the output formatter.
. . .
Hope that was helpful and informative, leave the StateArt GitHub Repository better than you found it by adding your own ⭐️ to it.
Because we developers often do this!

And I need more energy to keep doing this


Jokes apart, Please feel free to raise feature requests and report issues at the GitHub repo, Your pull requests and the reviews in the JetBrains plugin page are more than welcome.